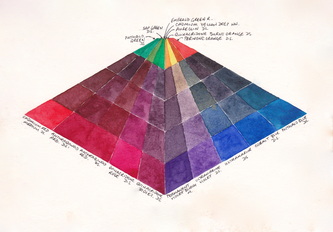
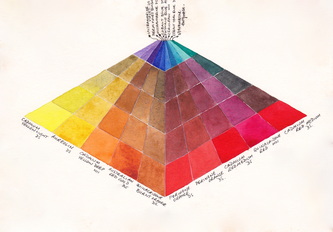
Watercolour Mixing Charts.
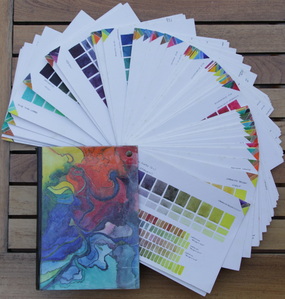
My original mixing charts.
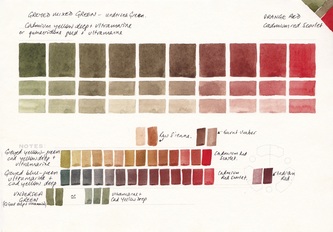
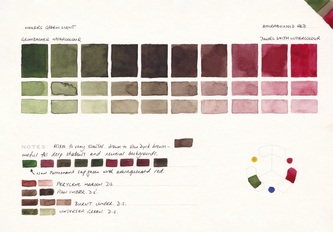
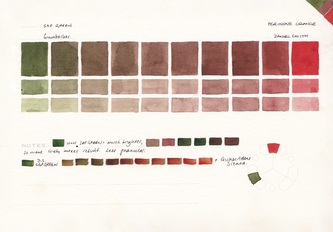
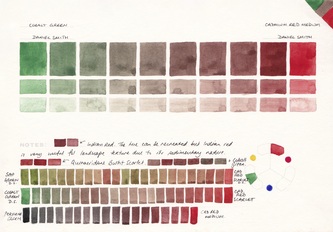
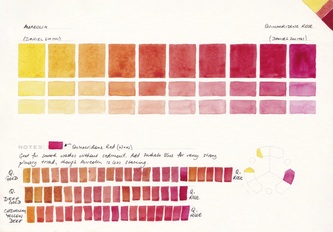
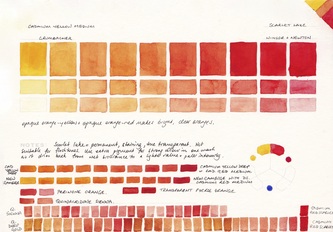
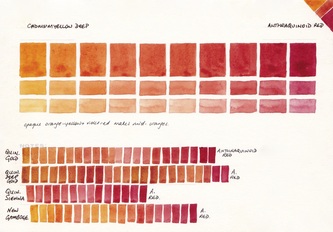
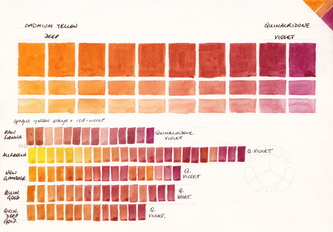
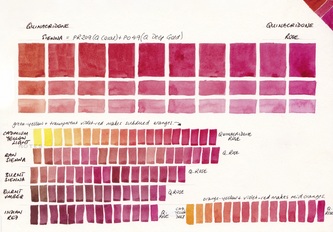
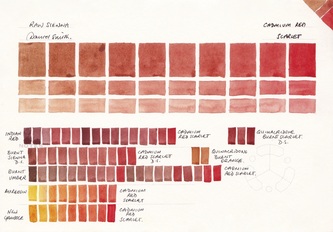
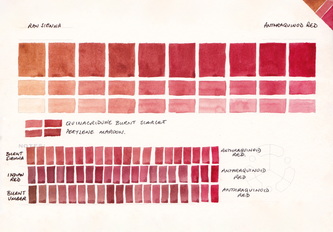
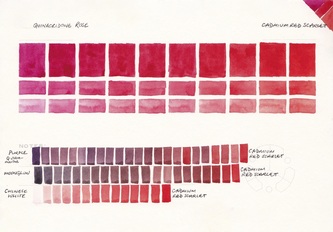
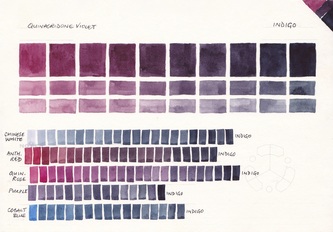
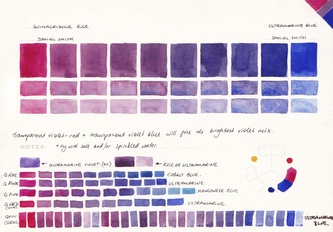
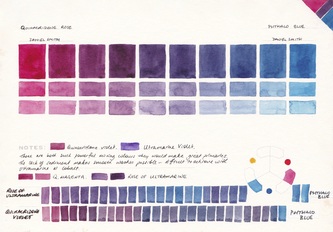
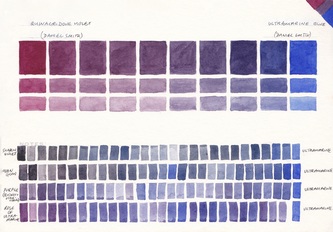
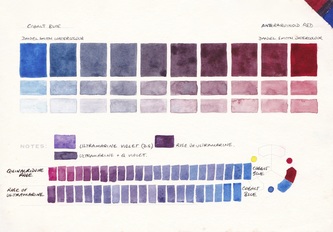
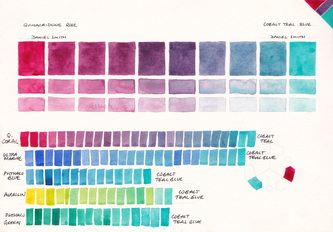
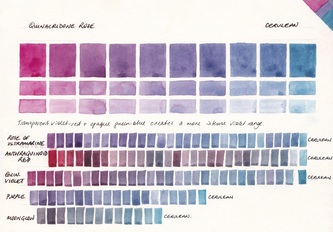
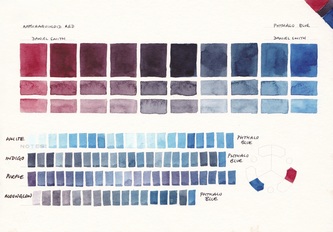
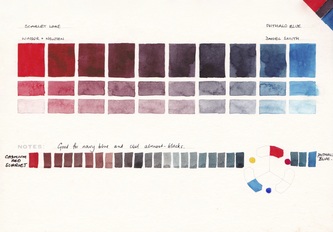
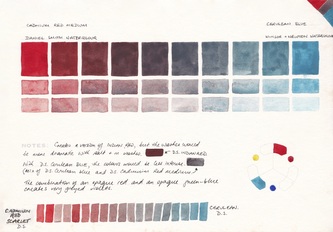
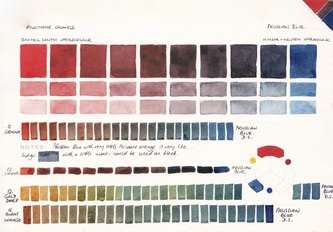
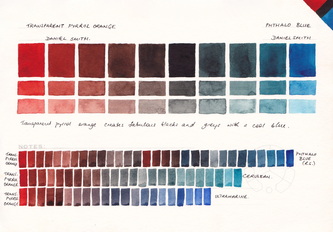
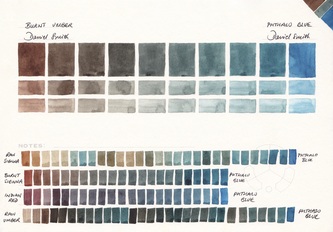
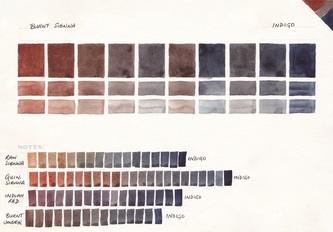
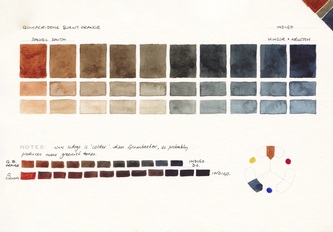
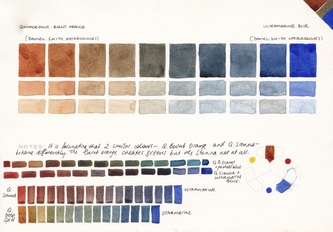
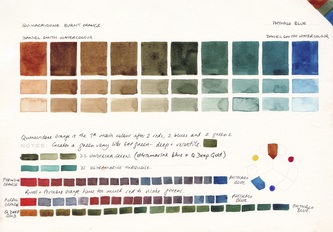
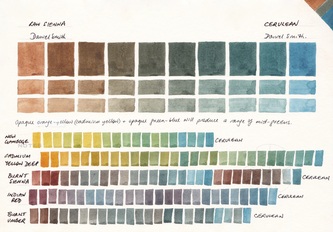
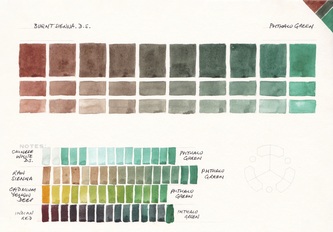
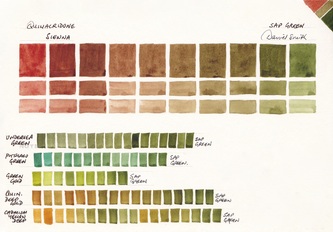
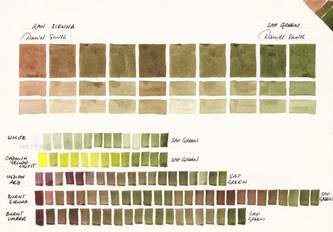
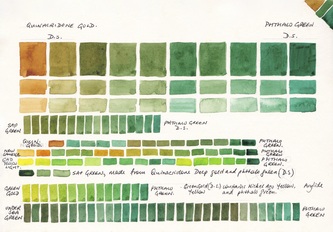
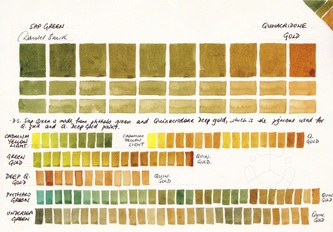
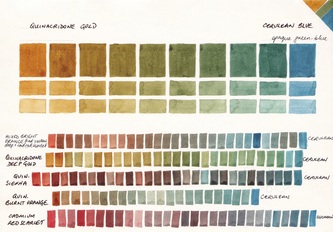
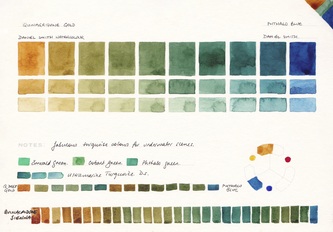
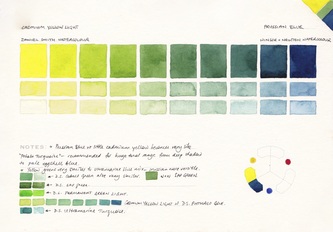
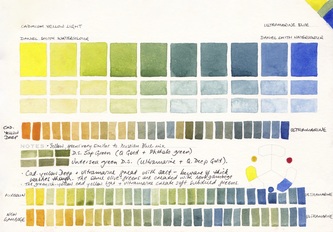
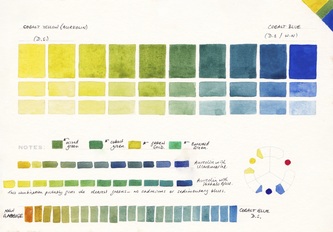
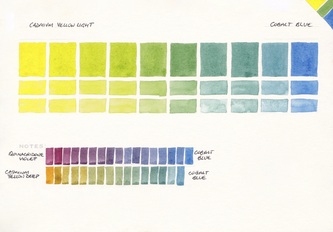
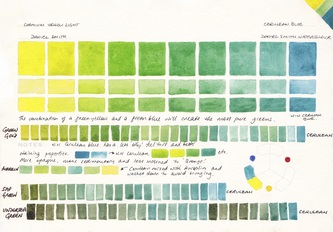
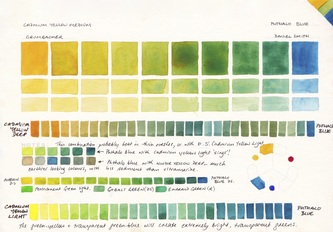
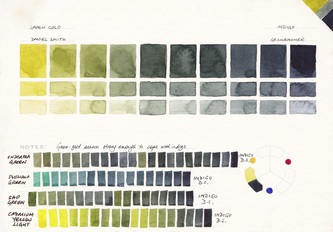
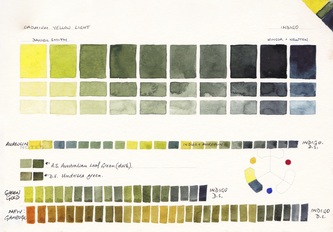
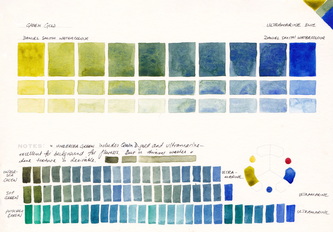
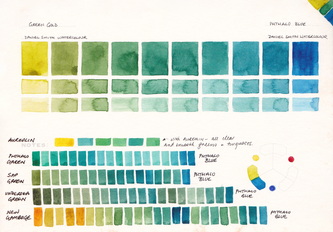
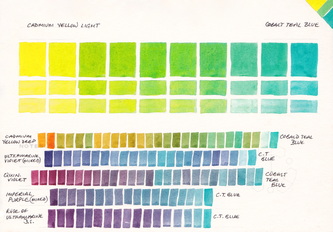
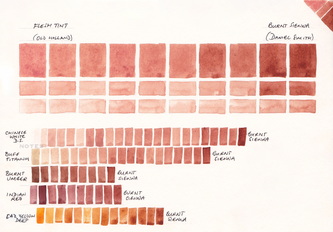
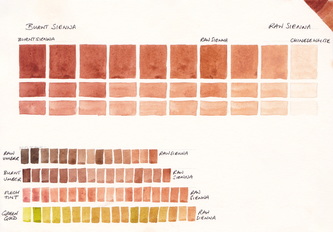
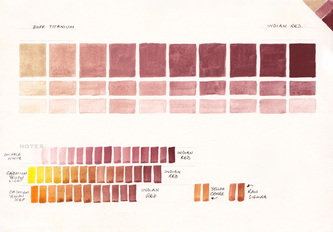
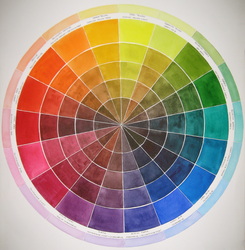
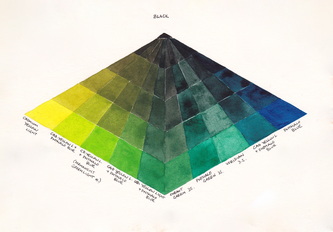
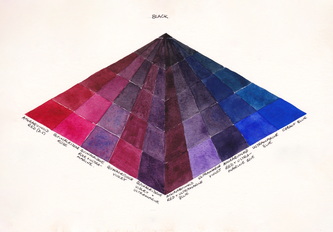
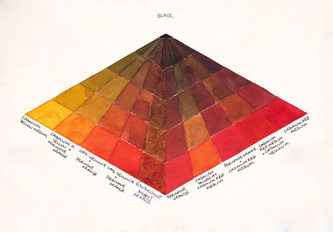
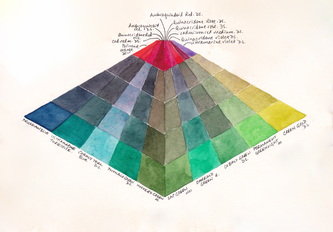
I love colour, and find the process of colour mixing fascinating. I have created many watercolour mixing charts over a number of years that are very useful in my teaching and enabled me to be thoroughly familiar with my colours. I will share them here. Some are full charts with tints created by adding water, others are simply mixing the colours in a line. They were painted using Daniel Smith watercolours unless stated otherwise. Click on any card to see a larger version.
While it is obviously most useful to do these charts yourself with your own paints and chosen colours, it takes a lot of time. I hope you will find them a helpful resource, if only to decide which charts your wish to paint for yourself.
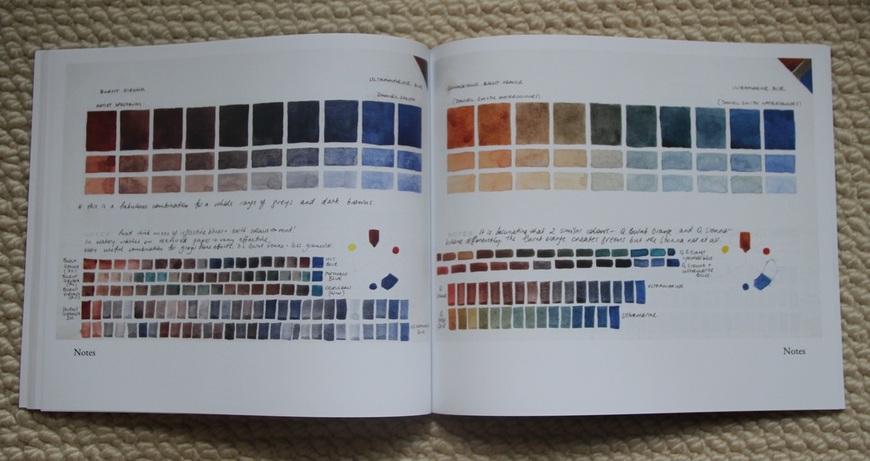
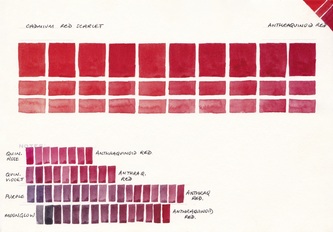
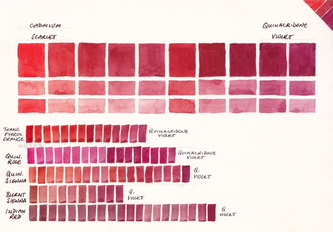
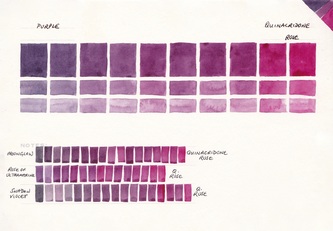
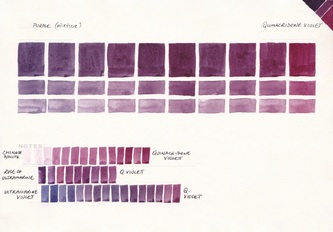
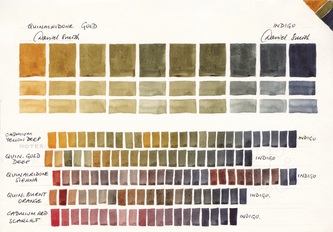
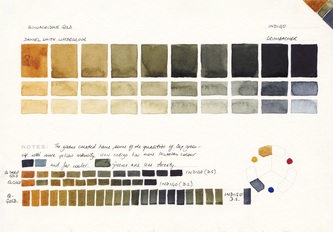
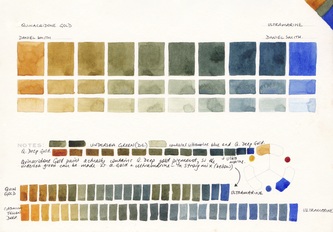
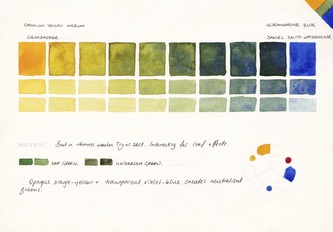
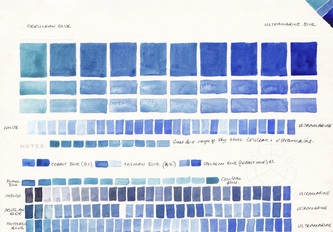
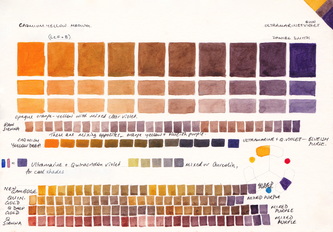
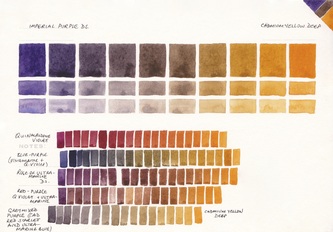
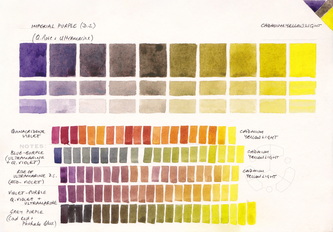
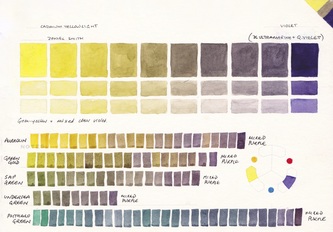
The charts were painted on cards designed by Michael Wilcox, author of 'Blue and Yellow don't make Green' and the incredibly informative 'The Wilcox Guide to the Finest Watercolour Paints'. I found a large number of them, slightly water-damaged, and bought the lot :-) These are the original charts on the left, held in a cover I painted.
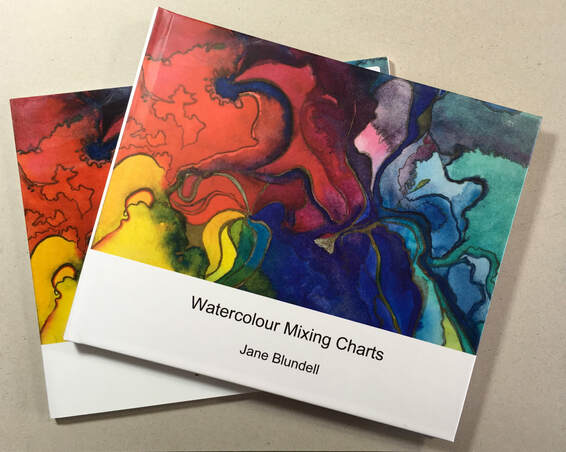 Watercolour Mixing Charts - Blurb hard and soft cover self-published books.
You can buy a book of these charts in a 100 page 'medium landscape' format (25cm wide x 21cm high) from Blurb.com. It is available in either hard cover or soft cover with standard paper. It is called Watercolour Mixing Charts. The hard cover is shown on the top, the soft underneath.
Click here to see the Blurb book preview, which shows the whole book.
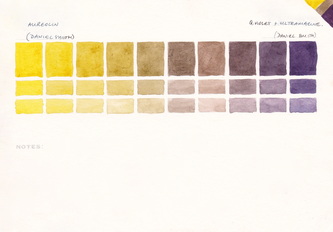
Both book versions contain all my original annotations, with room for your own notes, as shown below.
2015 update - I have re-edited all the charts and cleaned them up further using Photoshop. I also added chart numbers to make it a little easier to navigate the book :-) The second edition is now listed in Blurb.com as follows -
- eBook version can be found here http://www.blurb.com/ebooks/473089-watercolour-mixing-charts
- Printed book version can be found here - choose hard or softcover http://www.blurb.com/b/3736881-watercolour-mixing-charts
- PDF version can be found here - http://www.blurb.com/b/3736881-watercolour-mixing-charts - choose PDF version, suitable for any platform.
The second book is The Ultimate Mixing Palette: a World of Colours, which can be seen here. This is a book created using just 15 colours.
The third book, a follow-up book for The Ultimate Mixing Palette, is Watercolour Triads, which can be seen here.
|
If you find my website useful, you may like to donate so I can continue to keep it free and up-dated :-)
|
|
Please note - for only $9.99 you can download an eBook of these charts. They have been carefully cleaned up further for the second edition. Please respect the time I have put into these charts and don't steal them :-(
Here you can see the original scans of my charts. (I won't be re-loading the cleaned up versions here.)
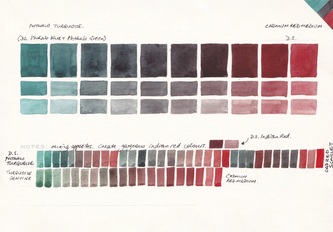
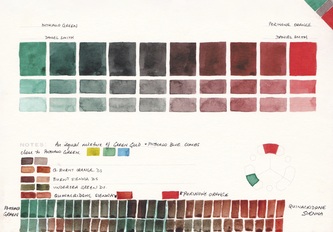
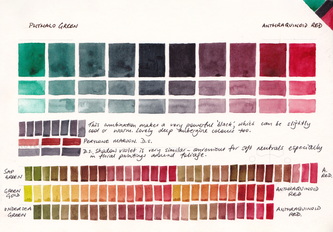
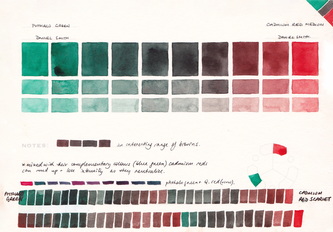
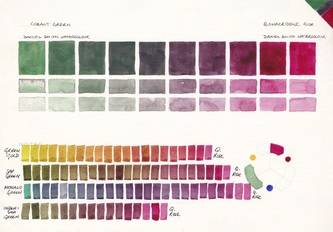
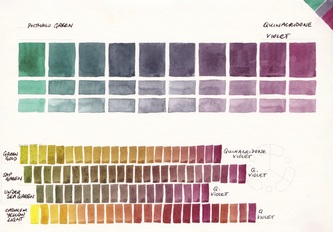
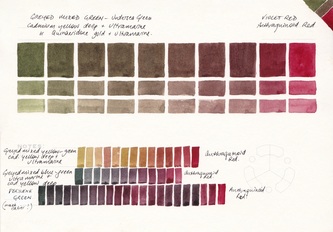
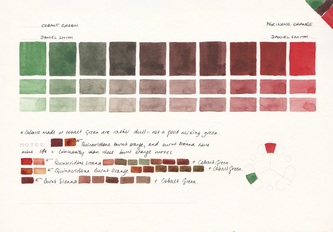
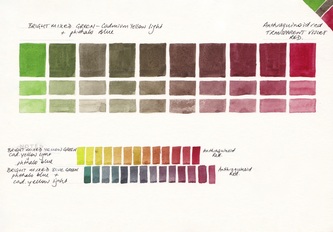
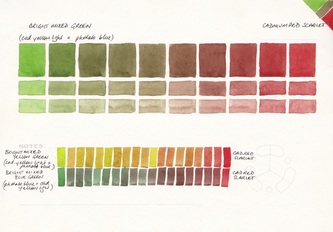
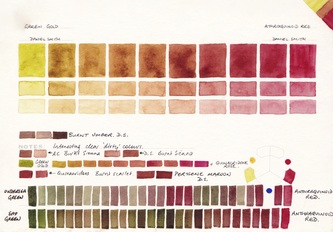
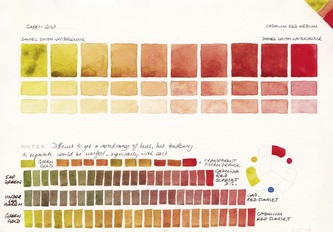
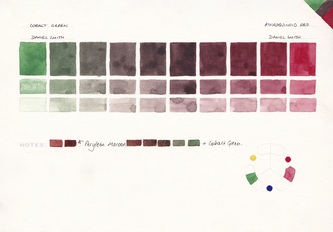
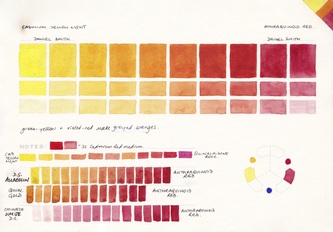
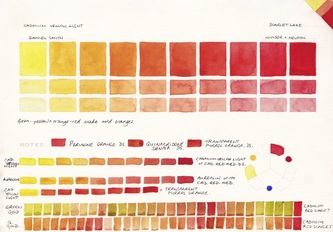
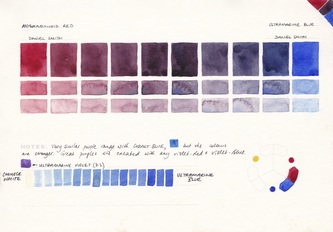
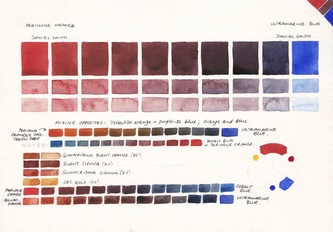
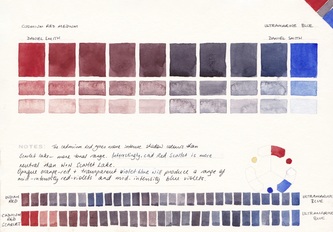
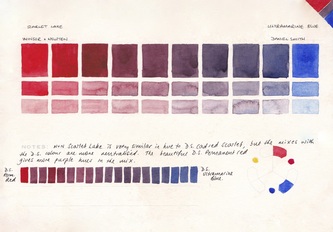
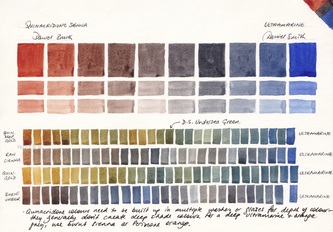
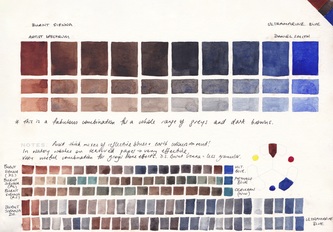
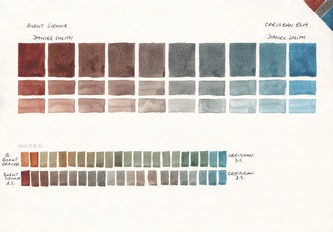
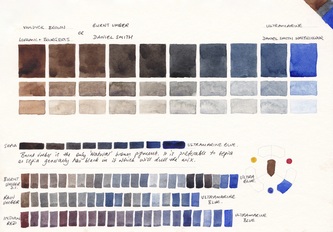
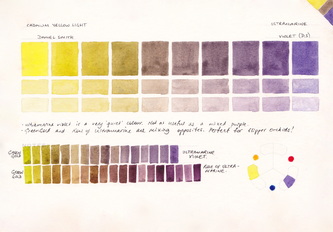
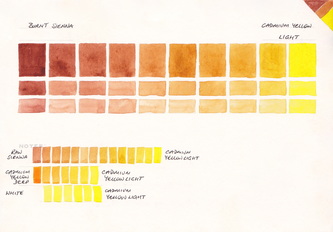
The charts are organised in the book in double page spreads. One side will have the colour - for example Phthalo green - mixed with a cool red and the other side will have the same colour mixed with a warm red. Below the main mixes will be more mixes showing either the phthalo green mixed with other reds or the red mixed with other greens.
The top charts were created with great care to show the full strength mix at the top, in very even steps, then a diluted range below in careful steps, then a watered down range below that. It was very time consuming.
The other mixes in the bottom of the charts were done in a more random manner since I wanted to show more information in a more compressed space. They show a range of mixes using more or less water and more or less of each colour, but not in a careful logical order.
|
If you find my website and blog useful, please consider making a one-off donation or perhaps a regular payment to help me keep my content free and up to date :-)
|
|
